D.Writing

Unit 11: Sources of energy - Các nguồn năng lượng
D.Writing
Task 1. Study the chart about energy consumption in Highland in 2000 and fill in the gaps with the information from the chart./(Nghiên cứu biểu đồ về tiêu thụ năng lượng ở Tây Nguyên năm 2000 và điền vào các chỗ trống với các thông tin từ biểu đồ.)
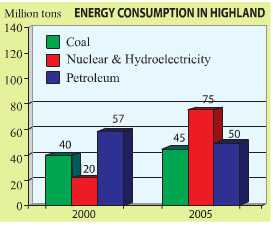
The chart shows the energy consumption in Highland in 2000. As can be seen, the total energy consumption was (1) _____ million tons petroleum made up the largest amount of this figure (57 million tons). This was followed by the consumption of (2) _____ (40 million tons). Nuclear & Hydroelectrieity made up the (3) _____ amount of energy consumption (20 million tons).
Lời giải:
The chart shows the energy consumption in Highland in 2000. As can be seen, the total energy consumption was (1) 100 million tons petroleum made up the largest amount of this figure (57 million tons). This was followed by the consumption of (2) Coal (40 million tons). Nuclear & Hydroelectrieity made up the (3) smallest amount of enersy consumption (20 million tons).
Hướng dẫn dịch:
Biểu đồ cho thấy mức tiêu thụ năng lượng ở Tây Nguyên trong năm 2000. Như có thể thấy, tổng mức tiêu thụ năng lượng là (1) 100 triệu tấn trong đó dầu mỏ chiếm số lượng lớn nhất (57 triệu tấn). Tiếp đó là tiêu thụ (2) than (40 triệu tấn). Năng lượng hạt nhân và thủy điện chiếm (3) mức tiêu thụ nhỏ nhất (20 triệu tấn).
Task 2. Continue your description of the trends in energy consumption in the year 2005 in Highland./(Tiếp tục mô tả của bạn về các xu hướng tiêu thụ năng lượng trong năm 2005 tại Tây Nguyên).
Lời giải:
The chart shows the energy consumption in Highland in 2005. As can be seen, the total energy consumption was 170 million tons. Nuclear and Hydroelectricity made up the largest amount of this figure (75 million tons). This was followed by the consumption of petroleum (50 million tons). Coal made up the smallest amount of energy consumption (45 million tons).
Hướng dẫn dịch:
Biểu đồ cho thấy mức tiêu thụ năng lượng ở Tây Nguyên trong năm 2005. Ta có thể thấy, tổng tiêu thụ năng lượng là 170 triệu tấn.Năng lượng hạt nhân và thủy điện chiếm lượng lớn nhất (75 triệu tấn). Tiếp đó là tiêu thụ xăng dầu (50 triệu tấn). Than đá chiếm ít năng lượng tiêu thụ nhất (45 triệu tấn).
Task 3. Describe the chart, using the information from Task 1 and Task 2./(Mô tả biểu đồ, sử dụng các thông tin từ Task 1 và Task 2.)
Lời giải:
The chart shows the energy consumption in Highland in 2000 and 2005. It's clear that the total energy consumption was 287 millions tons in two years. Petroleum made up the largest amount in 2000 (57 million tons) whereas the petroleum consumption was 50 million in 2005. In 2000 the consumption of coal came the second (40 million tons); however this consumption came the third (45 millions tons) in 2005 after the petroleum consumption. And the consumption of Nuclear and Hydroelectricity was 20 million in 2000. Nevertheless, nuclear and hydroelectricity consumption was 75 million tons in 2005. In conclusion, the energy consumption in Highland in 2000 is less than that in 2005.
Hướng dẫn dịch:
Biểu đồ cho thấy mức tiêu thụ năng lượng ở Tây Nguyên trong năm 2000 và 2005. Rõ ràng là tổng tiêu thụ năng lượng là 287 triệu tấn trong hai năm. Dầu mỏ chiếm số lượng lớn nhất vào năm 2000 (57 triệu tấn) trong khi tiêu thụ xăng dầu là 50 triệu vào năm 2005. Năm 2000, tiêu thụ than đứng thứ hai (40 triệu tấn); tuy nhiên mức tiêu thụ này là thứ ba (45 triệu tấn) vào năm 2005 sau tiêu thụ xăng dầu. Và mức tiêu thụ của hạt nhân và thủy điện là 20 triệu vào năm 2000. Tuy nhiên, tiêu thụ năng lượng hạt nhân và thủy điện năm 2005 là 75 triệu tấn. Tóm lại, mức tiêu thụ năng lượng ở Tây Nguyên năm 2000 ít hơn năm 2005.
Xem toàn bộ Soạn Anh 11: Unit 11. Sources of energy
Câu hỏi thường gặp
Xem thêm các bài cùng chuyên mục
Tham khảo các bài học khác


CÔNG TY TNHH TOP EDU
Số giấy chứng nhận đăng kí kinh doanh: 0109850622, cấp ngày 09/11/2021, nơi cấp Sở Kế Hoạch và Đầu tư Thành phố Hà Nội
